
June 2026

Was “Sell in May” the right call in the end?

Download as pdf

1

World equities recorded a negative month despite improving chances for durable peace in the Middle East.

2

The Magnificent 7 are down -10% bringing the S&P 500 into the red for the month of June, but AI enablers reach record highs.

3

The US yield curve flattened as the possibility of a more restrictive Fed policy resulted in higher short-term interest rate, and lower 10-year interest rate on receding inflation fears.

4

Precious metals, bitcoin and energy are down double digits in June.

Authored by Gilles Prince
Chief Investment Officer

Experts in what we do

Last month

Was “Sell in May” the right call in the end? Global equities ended the month slightly lower, led by the mega large technology companies, with a modest decline of -1.6%. This does not qualify as a correction but marks a pause after three months of strong gains. Investor sentiment remained sensitive to geopolitical and macroeconomic developments, shifting between caution and renewed optimism. Market performance was primarily driven by sector rotation and dispersion rather than broad-based weakness.

Geopolitically, renewed dialogue between Iran and the United States improved the outlook for a potential bilateral agreement. While the situation remains fragile, markets responded constructively. Cargo flows through the Strait of Hormuz have partially resumed, and oil prices declined significantly, with Brent closing at USD 73—close to pre-conflict levels. Implied volatility also eased below 17%, reflecting improved risk appetite, and equity markets continued to draw support from earnings growth. Strong demand in primary markets, illustrated by the successful SpaceX IPO, confirms that investor appetite for growth themes—particularly in AI—remains robust. Upcoming IPOs in this space will provide further insight into the depth of this demand.

On the macroeconomic front, US data—including consumer activity, labour markets, and PMIs—continue to signal resilient growth. Should geopolitical tensions ease and inflation moderate, this momentum could strengthen further. However, inflation above 4% has led the Federal Reserve to reassess its policy outlook. Markets are increasingly pricing a firm anti-inflation stance from the new Fed Chair, Kevin Warsh, resulting in higher rate expectations. This has supported the US dollar but prompted a reassessment of valuations in technology equities. The “Magnificent 7” continued to underperform the broad market.

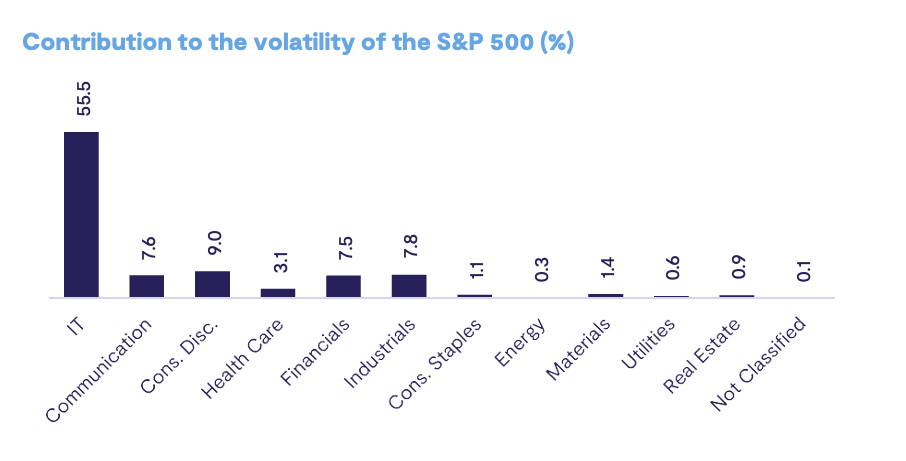
Index concentration remains a key risk consideration. The significant weight of large technology companies, notably the “Magnificent 7” and “hyperscalers” has weighed on headline index performance, while equal-weighted indices delivered positive returns. The technology sector now contributes more than 55% to the volatility of the S&P 500, with Nvidia alone accounting for nearly 12%, highlighting the concentration risk inherent in passive strategies. Note that these figures likely understate true exposure, as they exclude broader AI-related dependencies.

It would, however, be premature to conclude that the technology cycle has reversed. Rather, after substantial outperformance, investors are becoming more selective. In June, outperformance was observed in AI-enabling semiconductors, US small caps, value equities, and healthcare. Conversely, precious metals, bitcoin, energy, and the Magnificent 7 underperformed. As observed in late 2025 prior to the Iran conflict, European equities have resumed relative outperformance. We are selectively increasing exposure.
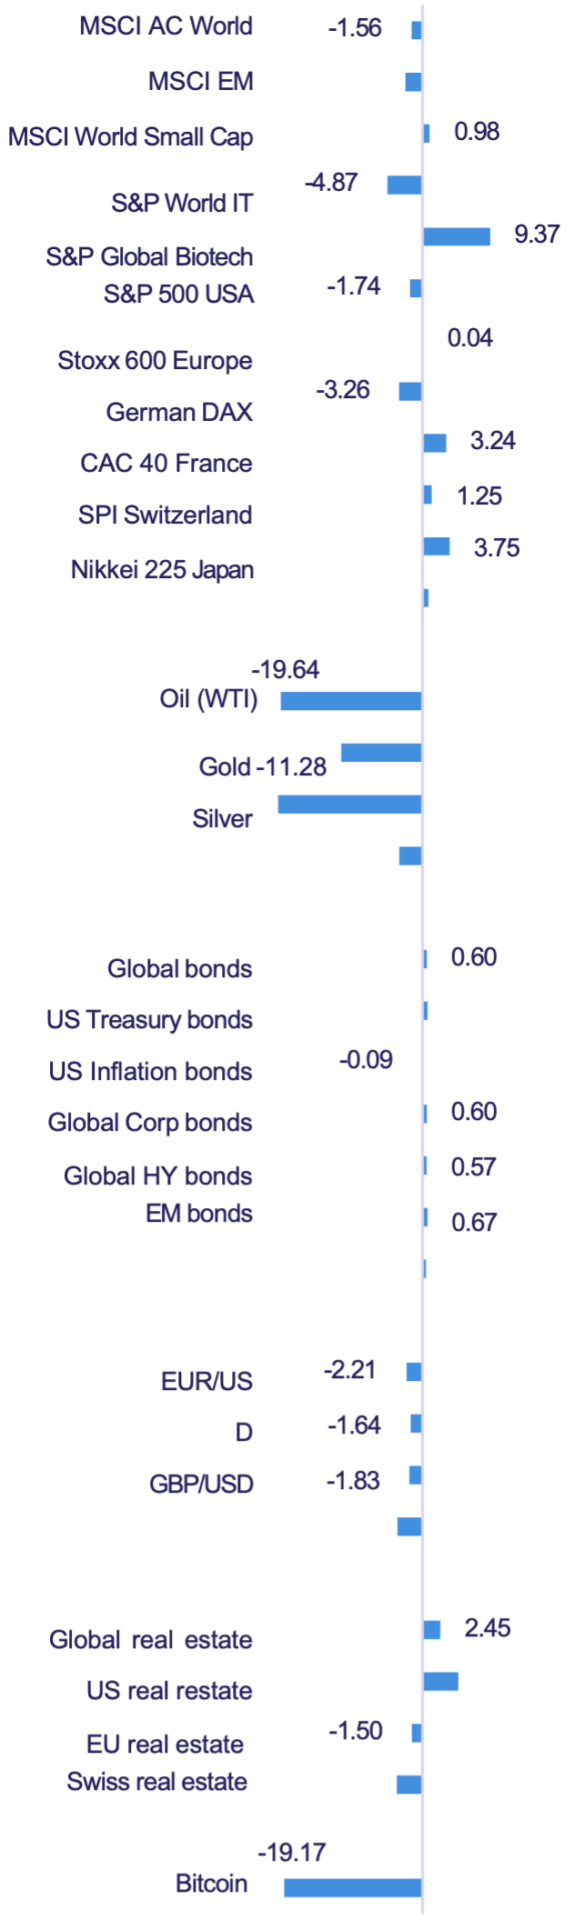
Scorecard

(In %, USD)

Monthly performances

Experts in what we do

The Views

Hidden risks and diversification

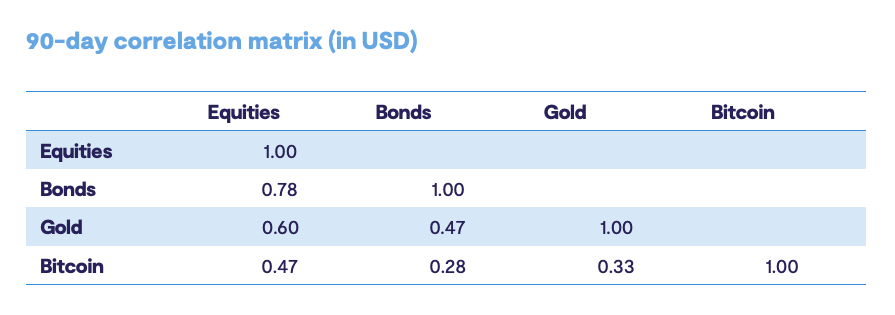
We are once again facing an environment where headline inflation is accelerating from levels already persistently above the 2% target, while policy rates are expected to rise as central banks act to contain inflation expectations. A comparable backdrop in 2022 led to a simultaneous drawdown in equities and bonds, with gold offering limited protection. Today, correlations are again moving unfavourably: global equities and bonds exhibit a strong positive correlation of 0.78, while gold shows a 0.60 correlation with equities. This convergence suggests that traditional multi-asset portfolios may offer reduced diversification benefits and could be more exposed in a market downturn.

A second consideration is the pervasive influence of the AI theme across asset classes. The structural impact of AI is broad, spanning households, corporates, software integration, hardware demand, infrastructure build-out, and energy consumption. Within equities, we estimate that AI-related companies—defined broadly—account for approximately 40–45% of the S&P 500. A factor-based decomposition indicates that 65–70% of index volatility is now driven by this theme. This concentration creates vulnerability to a potential “AI winter,” particularly given the significant weight of large technology hyperscalers in the index.

In this context, achieving steady long-term performance requires portfolios that are robust—or ideally anti-fragile—and free from unrecognised concentration risks. Without adopting an excessively contrarian stance, we see merit in selectively incorporating alternative strategies such as managed futures, global macro, and tail-hedge or convex approaches to enhance portfolio resilience. Within equities, diversification beyond technology-heavy exposures remains prudent. Allocations to European or Swiss markets, as well as to value and small-cap segments, can help mitigate downside risk. While such positioning may weigh on short-term relative performance, it can meaningfully reduce vulnerability to sharp increases in volatility and adverse market regimes.

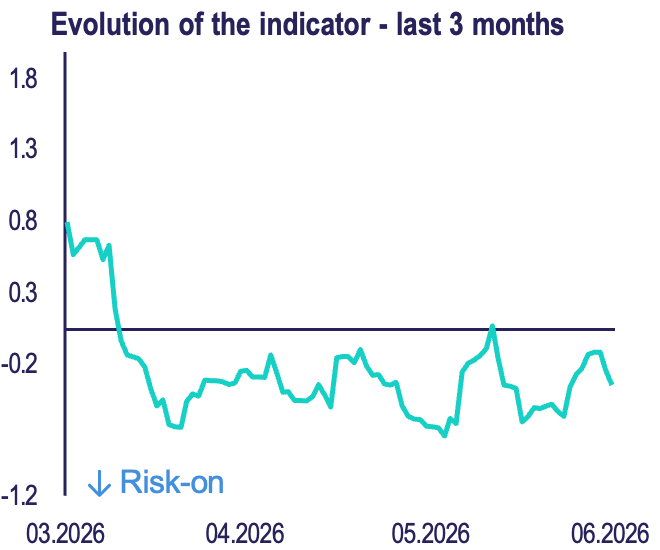
Risk Indicator

The Bluebox risk indicator has been oscillating in line with market events and with the somehow conflicting geopolitical news. Remaining in negative territory, the indicator reflects the optimism prevailing in markets.

The BlueBox Global Risk Indicator summarizes 20 market variables such as implied volatilities, implied correlations, or credit spreads into a normalized index. A positive number indicates a higher-than-average risk level, i.e. market stress. Low levels are indicators of normally behaving markets, while strongly negative readings (<-1) correspond to market complacency. The indicator is global and can be compared to a speedometer of financial markets. Please contact us for further information. 

April 2026

Equities rebounded strongly

Headline inflation is increasing, but major central banks kept their policy rates unchanged in April.

Read article

June 2026

Was “Sell in May” the right call in the end?

Global markets paused as AI leadership shifted, inflation stayed elevated, and diversification became more critical.

Read article

July 2026

Equity and bond market indices recorded lacklustre performance

Global market performance shaped by geopolitical tensions, inflation concerns, and volatility in AI-related technology stocks.

Read article