
July 2026

Equity and bond market indices recorded lacklustre performance

Download as pdf

1

Equity indices were driven down by technology stocks. Most concentrated indices recorded a negative month.

2

Tensions flared up again in the Middle East pushing up oil prices above $90/bbl.

3

The US administration is adding to market uncertainties by actioning trade tariffs again.

4

Interest rates are moving up on worries that inflation could be higher for longer, while central banks keep policy rates on hold.

Authored by Gilles Prince
Chief Investment Officer

Experts in what we do

Last month

Equity and bond market indices recorded lacklustre performance in July, driven by a combination of two factors. Firstly, renewed tensions in the Middle East pushed energy prices higher, reigniting inflation concerns and putting upward pressure on interest rates. Secondly, growing doubts about AI-related demand and the associated capital expenditure intensity sent semiconductors and memory stocks sharply lower, dragging concentrated indices down in both emerging and developed markets.

In equities, indices less exposed to technology and the broader AI theme delivered the strongest performance in July. In a sign of broadening market leadership, equal-weighted small- and large-cap indices outperformed their market-cap-weighted counterparts. The concentration risk we discussed last month began to materialise, as momentum trades started to unwind.

Semiconductors entered bear market territory, declining 20% in July and leaving the global technology sector down 4.3%. Reassuring earnings from hyperscalers helped mitigate the index drawdown, while previously neglected software stocks rebounded meaningfully. Dispersion both within and across sectors was high: global technology, industrials and utilities declined for the month, while global energy stocks and software both gained 12%. Diversification into European equities helped mitigate volatility, an effect amplified for USD-based investors who benefited from a stronger euro and Swiss franc. The same did not hold for emerging market indices, which declined 3.1% in US dollar terms, dragged down by their heavy technology weighting.

In fixed income, the uncertain reaction function of central banks amid renewed inflation fears and oil futures trading back above $90/bbl led to both higher interest rates and wider credit spreads. In a clear uptrend since the beginning of the year, the 10-year US Treasury added 35bps to reach 4.73%. Among the 107 fixed income indices we follow, only 7 recorded a positive return in July. Overweighting money market instruments has added value, as bonds have not compensated for poor equity returns.

In currencies, attention centred on the Japanese yen, which reached its lowest level against the US dollar since 1986 at 164 yen per dollar. This extreme low triggered concerted intervention by the Bank of Japan and the Federal Reserve to support the yen. As a result, the currency closed the month at 159, although whether those gains are sustainable remains an open question. A further appreciation of the yen would also heighten the risk of a carry-trade reversal, reminiscent of the market stress observed in August 2024

All in all, market sentiment and risk indicators remain constructive, but some discomfort is spreading. We maintain our asset allocation with lower fixed income and higher cash exposure, while keeping a neutral equity exposure where we emphasise diversification.
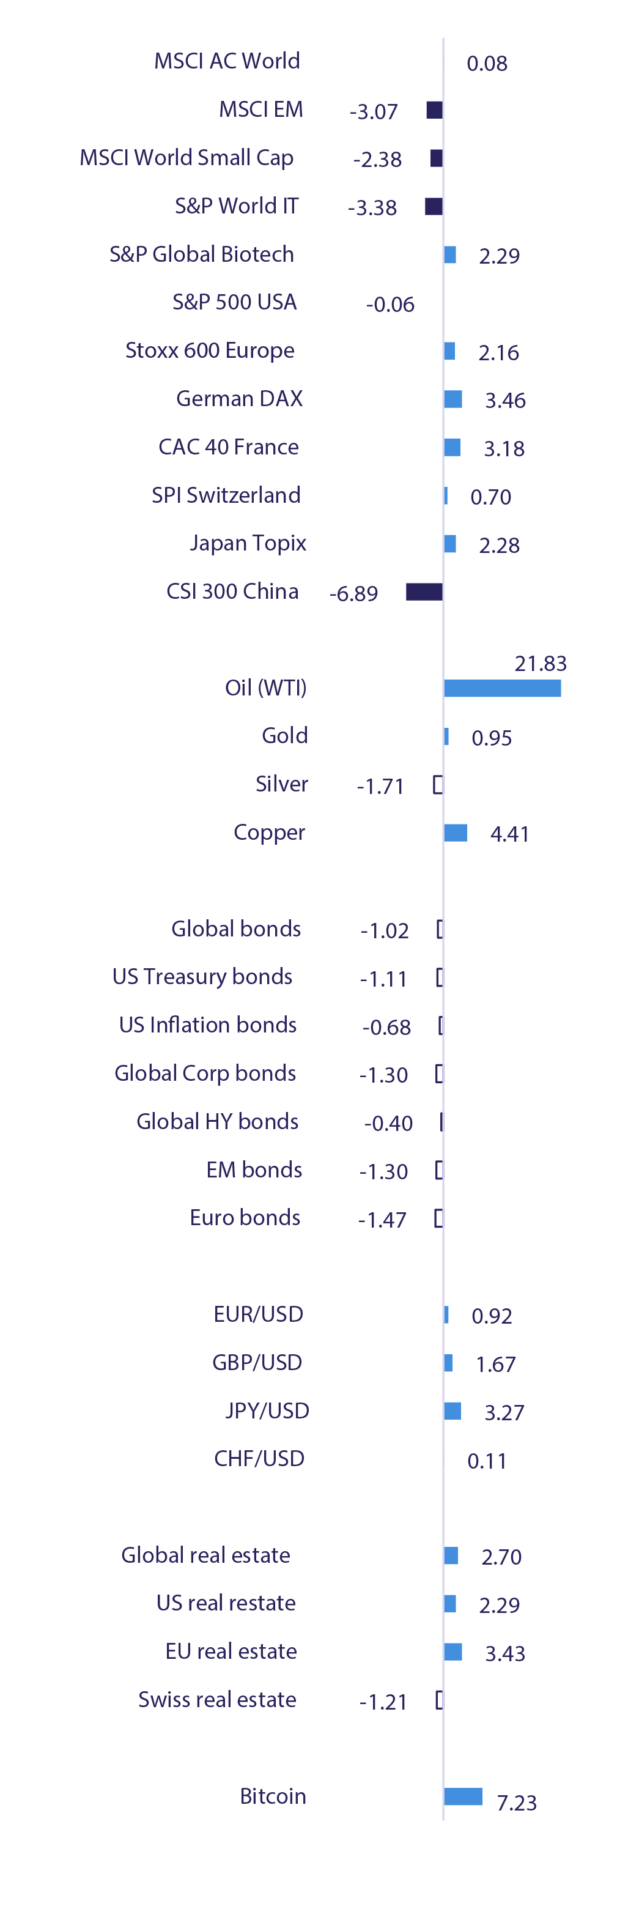
Scorecard

(In %, USD)

Monthly performances

Experts in what we do

The Views

If it smells and tastes like a bubble…

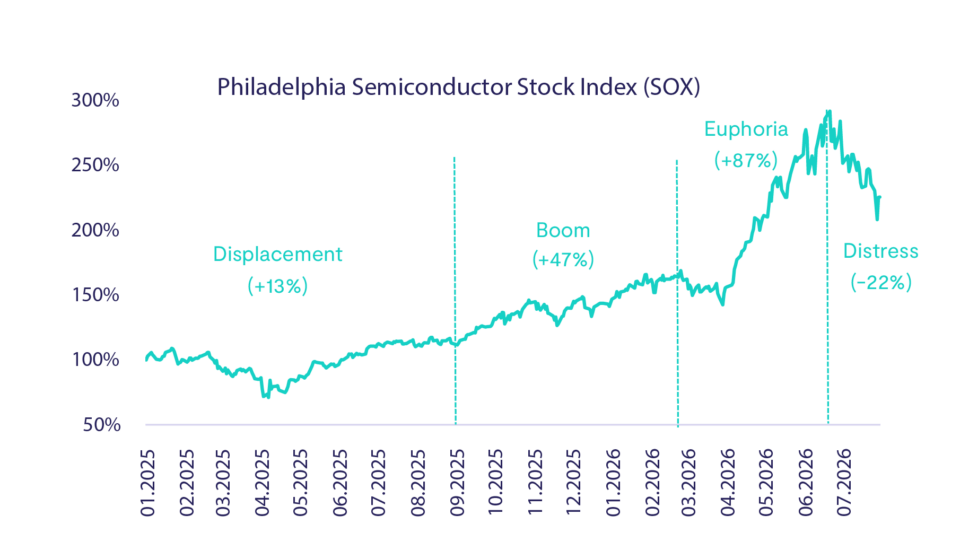
The recent performance and volatility of semiconductor and memory stocks have been extraordinary in both directions. Representative AI-enabling companies such as Micron (US) and SK Hynix (South Korea) have gained 188% and 427% year-to-date, respectively, despite retracements of -28% and -35% in July. More broadly, the semiconductor index remains up 59% year-to-date following a -20% correction in July. To note, the Korean stock index has become more volatile than bitcoin.

Investors who followed the AI narrative are now experiencing the sharp reversal typical of momentum-driven cycles. Such speculative dynamics are not new in financial history, though their explanation often lies more in behavioural finance than in fundamentals. Increasingly, the pattern resembles the classical phases of a speculative bubble:

  • Displacement: A structural opportunity is identified, triggering capital inflows into the innovative technology and its value chain.
  • Boom: Rapid price appreciation attracts new participants, earnings expectations are extrapolated, leverage increases, and valuations are justified by growth narratives and expected forward earnings.
  • Euphoria: Price gains accelerate to extreme levels, momentum dominates fundamentals, and valuations are sustained primarily by narrative strength.
  • Distress: Insiders begin to question the financial sustainability of projects, prompting profit-taking and an initial correction. Margin calls force deleveraging, price discovery becomes impaired.
  • Capitulation: The narrative reverses, interconnected risks become apparent – often amplified by leverage – and assets are sold, sometimes in panic, leading to sharp and often exaggerated price declines.

July price action suggests we are most likely in the fourth phase – past euphoria, but not yet in capitulation. Margin calls are pressuring wrong-footed hedge funds, momentum-driven managers are taking profits or realizing losses, and retail investors face adverse outcomes on autocallable structured products. These flows contribute to heightened volatility and impair price discovery. As losses mount, convictions weaken, the narratives are likely to be reassessed, and investors might reallocate capital. Those who missed the initial rally may view the correction as an entry opportunity. Historical precedent, however, suggests such moves often constitute a bull trap, even if a short-term rebound occurs. Diversification has never been a bad strategy, especially in this context.


Risk Indicator

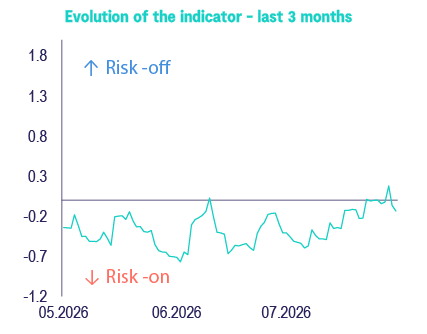
The Bluebox risk indicator has risen back toward neutral territory. Market stress has increased amid resurging tensions in the Middle East, higher interest rates, growing scepticism around AI and renewed inflation fears. Markets do not show signs of excessive stress, though we note some emerging discomfort that needs to be monitored.

The BlueBox Global Risk Indicator summarizes 20 market variables such as implied volatilities, implied correlations, or credit spreads into a normalized index. A positive number indicates a higher-than-average risk level, i.e. market stress. Low levels are indicators of normally behaving markets, while strongly negative readings (<-1) correspond to market complacency. The indicator is global and can be compared to a speedometer of financial markets. Please contact us for further information. 

April 2026

Equities rebounded strongly

Headline inflation is increasing, but major central banks kept their policy rates unchanged in April.

Read article

June 2026

Was “Sell in May” the right call in the end?

Global markets paused as AI leadership shifted, inflation stayed elevated, and diversification became more critical.

Read article

July 2026

Equity and bond market indices recorded lacklustre performance

Global market performance shaped by geopolitical tensions, inflation concerns, and volatility in AI-related technology stocks.

Read article